산업
Westown의 산업별 비즈니스 분포
| 산업 설명 | 시설 수 |
|---|---|
| 쇼핑 | 19 |
| 과학 및 기술 서비스 | 18 |
Westown 사실
| 지역 | 4.3 km² |
| 인구 | 9,537 |
| 남성 인구 | 4,581 (48.0%) |
| 여성 인구 | 4,956 (52.0%) |
| 인구 변화 (1975 to 2020) | +125.4% |
| 인구 변화 (2000 to 2020) | +61.9% |
| 연령 중앙값 | 40.6세 (남성: 39.4, 여성: 41.7) |
| 주민 | Westown, 20 Sunley Street |
| 현지 시간 | |
| 시간대 | 뉴질랜드 표준시 |
| 위도 및 경도 | -39.07135, 174.06215 |
| 우편 번호 | 4310 |
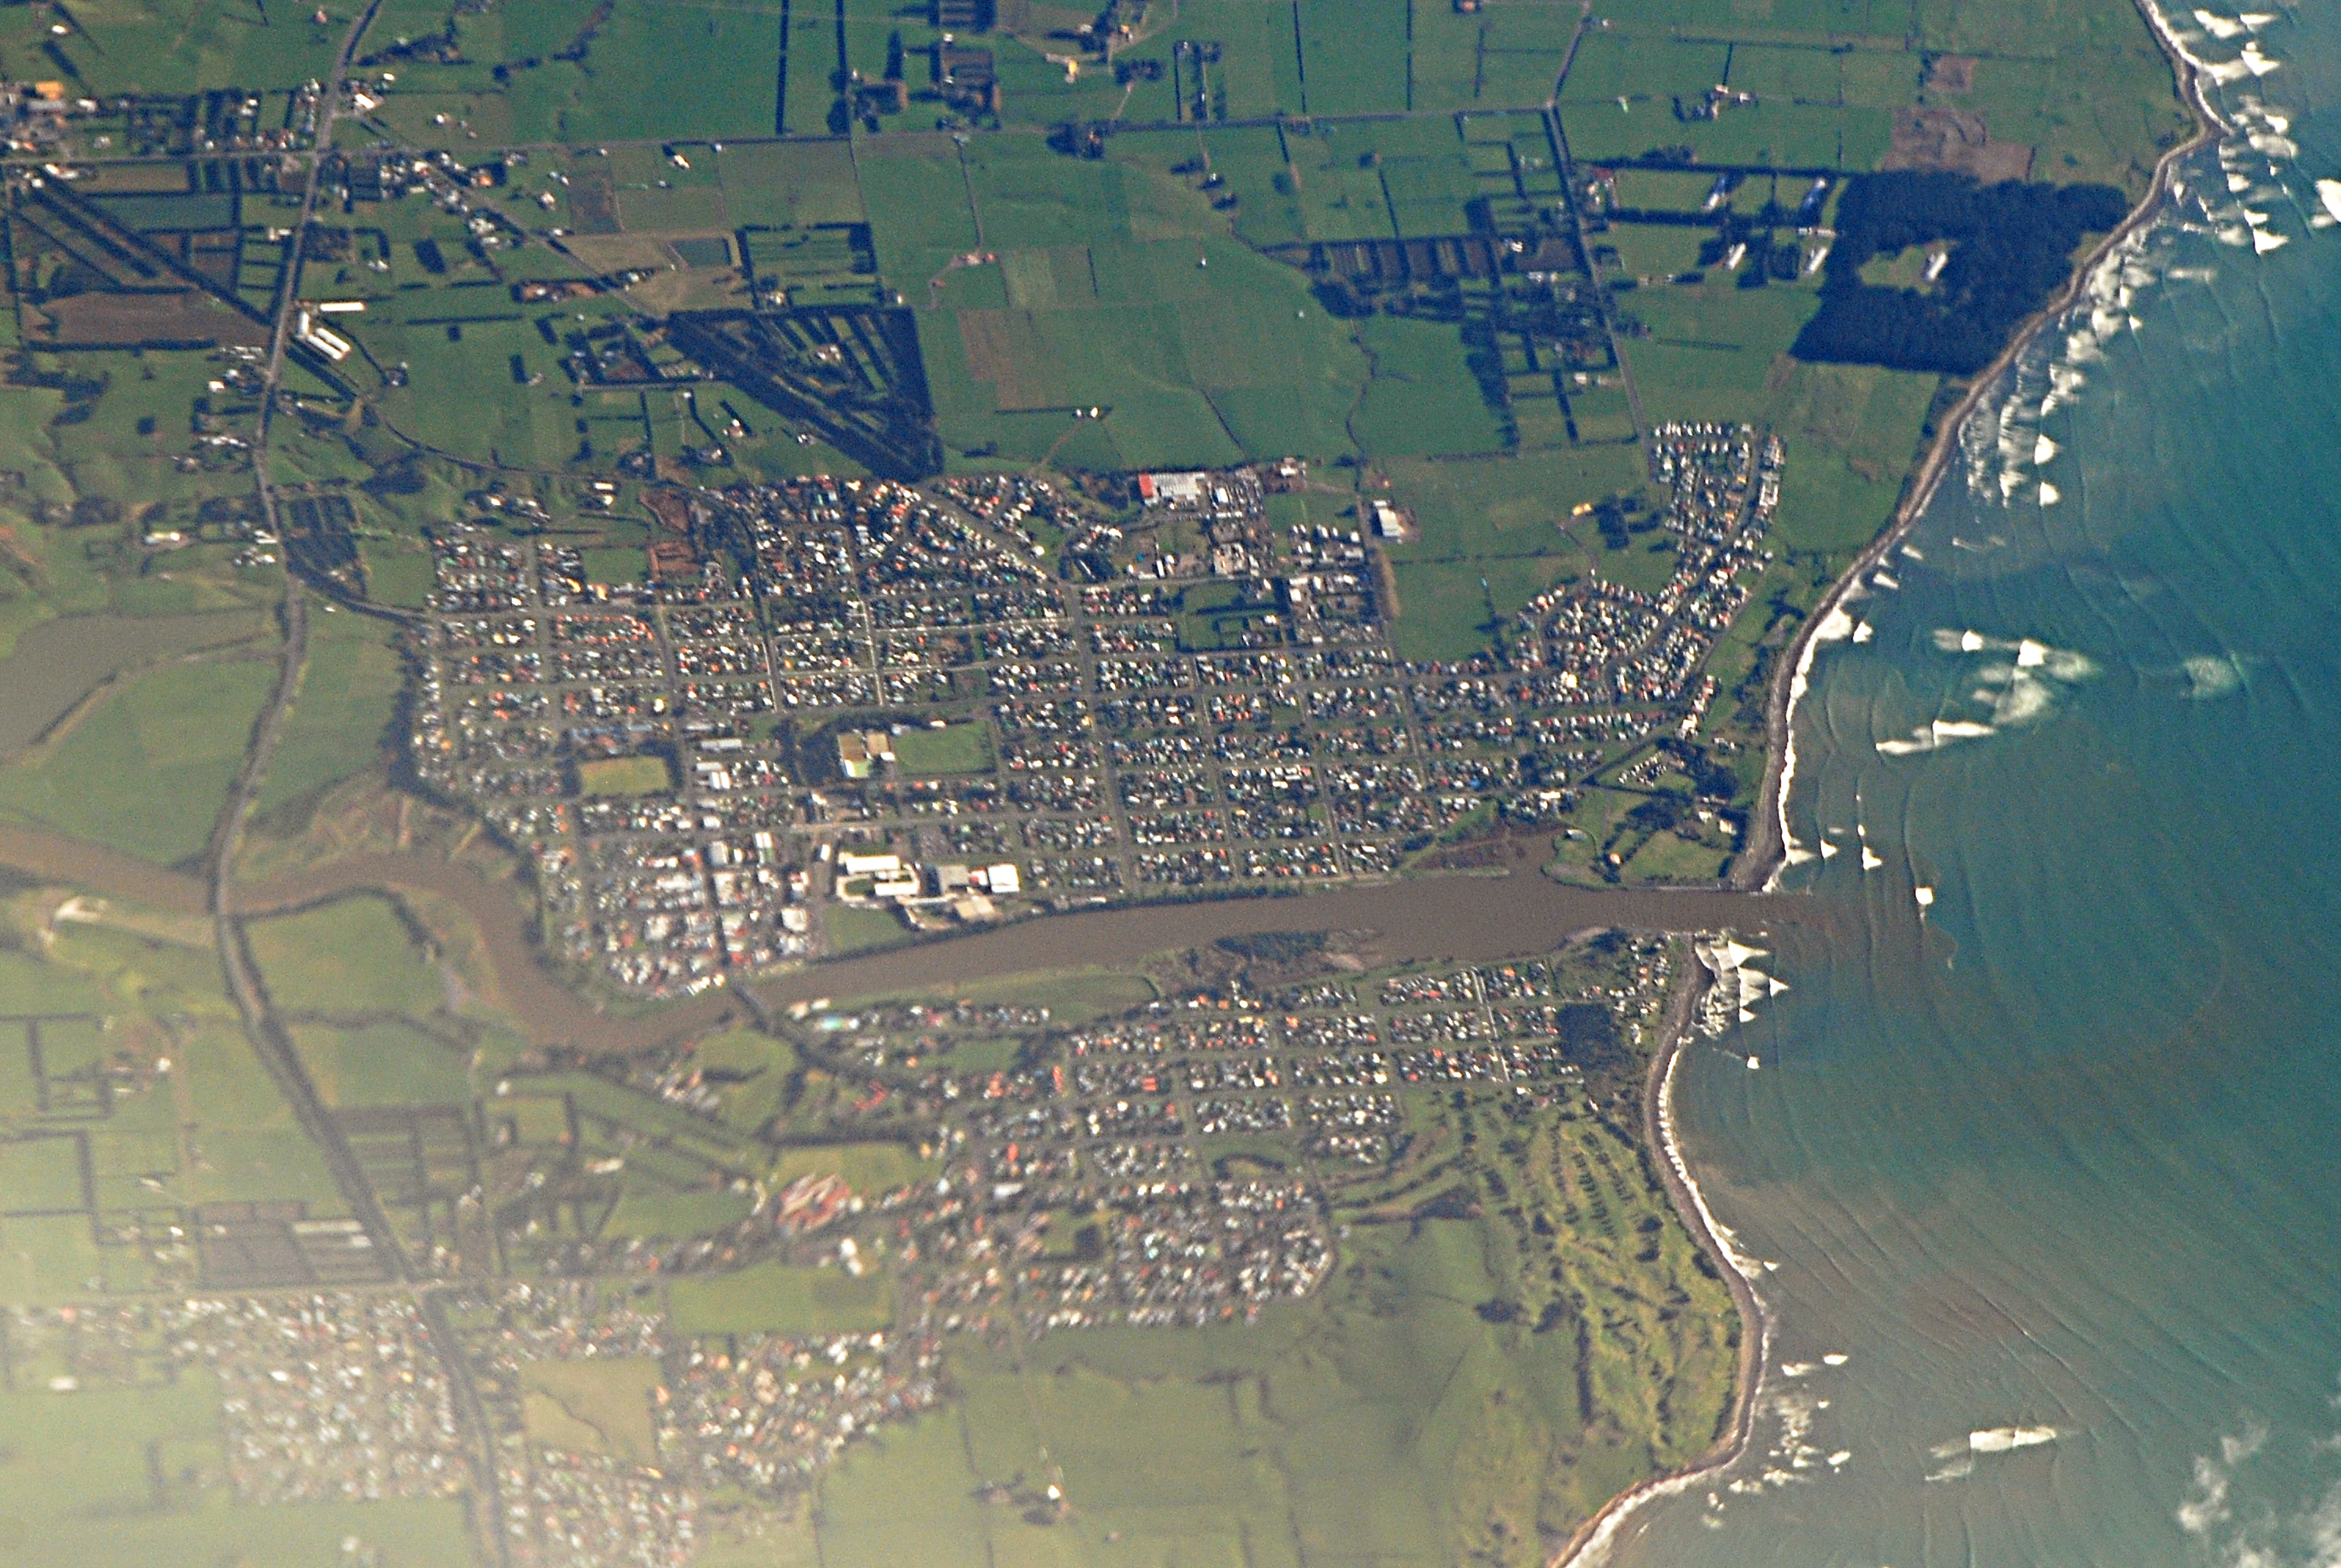
Westown 지도
대화식지도
Westown 인구
1975년부터 2030년까지
| Data | 1975 | 1990 | 2000 | 2015 | 2020 | 2025* | 2030* |
|---|---|---|---|---|---|---|---|
| 인구 | 4,232 | 5,049 | 5,890 | 7,266 | 9,537 | 10,041 | 10,441 |
| 인구 밀도 | 981.3 / km² | 1,170.8 / km² | 1,365.8 / km² | 1,684.9 / km² | 2,211.5 / km² | 2,328.3 / km² | 2,421.1 / km² |
* 예상
출처: JRC (유럽 위원회 공동 연구 센터) 다음에 대한 작업 GHS 시가화 격자2000년부터 2020년까지 Westown 인구 변화
2000년부터 2020년까지 61.9% 증가
| 위치 | 1975 이후 변화 | 1990 이후 변화 | 2000 이후 변화 |
|---|---|---|---|
| Westown | +125.4% | +88.9% | +61.9% |
| 타라나키 지방 | — | — | — |
| 뉴질랜드 | — | — | — |
출처: JRC (유럽 위원회 공동 연구 센터) 다음에 대한 작업 GHS 시가화 격자
Westown 중위 연령
중위 연령: 40.6세
| 위치 | 연령 중앙값 | 평균 연령 (여성) | 중간 나이 (남) |
|---|---|---|---|
| Westown | 40.6 yrs | 41.7 yrs | 39.4 yrs |
| 타라나키 지방 | 39.9 yrs | 40.8 yrs | 38.8 yrs |
| 뉴질랜드 | 37.9 yrs | 38.9 yrs | 36.9 yrs |
출처: CIESIN (Center for International Earth Science Information Network)
Westown 인구 밀도
인구 밀도: 2,212 / km²
| 위치 | 인구 | 지역 | 밀도 |
|---|---|---|---|
| Westown | 9,537 | 4.313 km² | 2,212 / km² |
| 타라나키 지방 | 116,941 | 12,703.1 km² | 9.2 / km² |
| 뉴질랜드 | 4.4 million | 270,103.3 km² | 16.3 / km² |
출처: JRC (유럽 위원회 공동 연구 센터) 다음에 대한 작업 GHS 시가화 격자
Westown 역사적 및 예상 인구
1830년부터 2100년까지의 예상 인구
출처:
- JRC (유럽 위원회 공동 연구 센터) 다음에 대한 작업 GHS built-up grid
- CIESIN (Center for International Earth Science Information Network)
- [링크] Klein Goldewijk, K., Beusen, A., Doelman, J., and Stehfest, E.: Anthropogenic land use estimates for the Holocene – HYDE 3.2, Earth Syst. Sci. Data, 9, 927–953, https://doi.org/10.5194/essd-9-927-2017, 2017.
인간 개발 지수 (HDI)
평균 수명, 교육 및 일인당 소득의 통계 복합 지수.
출처: [링크] Kummu, M., Taka, M. &Guillaume, J. 1990–2015년 국내총생산 및 인간개발지수에 대한 격자형 글로벌 데이터셋. Sci Data 5, 180004 (2018) doi:10.1038/sdata.2018.4
Westown CO2 배출량
일인당 연간 이산화탄소 배출량 (CO2)
| 위치 | 이산화탄소 배출 | 일인당 이산화탄소 배출량 | 이산화탄소 배출 강도 |
|---|---|---|---|
| Westown | 86,491 tn | 9.07 tn | 20,056 tons/km² |
| 타라나키 지방 | 600,363 tn | 5.13 tn | 47.3 tons/km² |
| 뉴질랜드 | 37,929,206 tn | 8.61 tn | 140.4 tons/km² |
출처: [링크] Moran, D., Kanemoto K; Jiborn, M., Wood, R., Többen, J., and Seto, K.C. (2018) 13,000개 도시의 탄소 발자국. Environmental Research Letters DOI: 10.1088/1748-9326/aac72a
Westown CO2 배출량
| 2013년 CO2 배출량 (톤/년) | 86,491 tn |
| 2013년 1인당 CO2 배출량 (톤/년) | 9.07 tn |
| 2013년 CO2 배출 강도 (톤/km²/년) | 20,056 tons/km² |
자연 재해 위험
10 개 중 상대 위험
| 위험 | 위험 수준 |
|---|---|
| 지진 | 높음 (8) |
| 집진 장치 | 중간 (5) |
| 산사태 | 중간 (6) |
* 특히 홍수 나 산사태와 관련된 위험은 전체 지역에 해당되지 않을 수 있습니다.
출처:
- Dilley, M., R.S. Chen, U. Deichmann, A.L. Lerner-Lam, M. Arnold, J. Agwe, P. Buys, O. Kjekstad, B. Lyon, and G. Yetman. 2005. Natural Disaster Hotspots: A Global Risk Analysis. Washington, D.C.: World Bank. https://doi.org/10.1596/0-8213-5930-4.
- Center for Hazards and Risk Research - CHRR - Columbia University, Center for International Earth Science Information Network - CIESIN - Columbia University, and Norwegian Geotechnical Institute - NGI. 2005. Global Landslide Hazard Distribution. Palisades, NY: NASA Socioeconomic Data and Applications Center (SEDAC). https://doi.org/10.7927/H4P848VZ.
- Center for Hazards and Risk Research - CHRR - Columbia University, Center for International Earth Science Information Network - CIESIN - Columbia University, International Bank for Reconstruction and Development - The World Bank, and United Nations Environment Programme Global Resource Information Database Geneva - UNEP/GRID-Geneva. 2005. Global Cyclone Hazard Frequency and Distribution. Palisades, NY: NASA Socioeconomic Data and Applications Center (SEDAC). https://doi.org/10.7927/H4CZ353K.
- Center for Hazards and Risk Research - CHRR - Columbia University, Center for International Earth Science Information Network - CIESIN - Columbia University. 2005. Global Earthquake Hazard Distribution - Peak Ground Acceleration. Palisades, NY: NASA Socioeconomic Data and Applications Center (SEDAC). https://doi.org/10.7927/H4BZ63ZS.
최근 인근 지진
크기 3.0 이상
| 날짜▼ | 시간↕ | Magnitude↕ | Distance↕ | 깊이↕ | 위치↕ | 링크 |
|---|---|---|---|---|---|---|
| 6/5/19 | 4:26 AM | 4.1 | 51.2 km | 253,660 m | 11km NW of Hawera, New Zealand | usgs.gov |
| 5/19/18 | 10:40 PM | 4.5 | 58.9 km | 206,980 m | 4km NE of Hawera, New Zealand | usgs.gov |
| 11/7/16 | 4:59 PM | 4.8 | 40.6 km | 19,000 m | 11km NNW of Opunake, New Zealand | usgs.gov |
| 1/11/13 | 5:35 AM | 4.6 | 41.7 km | 11,000 m | off the west coast of the North Island of New Zealand | usgs.gov |
| 6/23/12 | 8:10 PM | 4.1 | 63 km | 208,000 m | North Island of New Zealand | usgs.gov |
| 3/5/12 | 7:36 PM | 4.2 | 57.1 km | 226,800 m | North Island of New Zealand | usgs.gov |
| 2/19/12 | 8:07 AM | 5 | 34.9 km | 325,400 m | North Island of New Zealand | usgs.gov |
| 1/5/12 | 11:50 PM | 4.1 | 52.6 km | 32,000 m | North Island of New Zealand | usgs.gov |
| 11/4/11 | 8:23 AM | 4.1 | 47.1 km | 264,000 m | North Island of New Zealand | usgs.gov |
| 8/1/11 | 2:39 PM | 4.2 | 36.9 km | 271,300 m | North Island of New Zealand | usgs.gov |

우리의 데이터
이 페이지의 데이터는 여러 공개적으로 이용 가능한 도구와 자원을 사용하여 추정됩니다. 보증 없이 제공되며 부정확한 내용이 포함될 수 있습니다. 사용은 본인 책임입니다.