산업
Wellsford의 산업별 비즈니스 분포
| 산업 설명 | 시설 수 | 평균 사업 연령 | 평균 Google 평가 |
|---|---|---|---|
| 쇼핑 | 33 | 44 years | 4.4 |
| 레스토랑 | 16 | — | 4.2 |
| 과학 및 기술 서비스 | 13 | — | 5 |
| 자동차 수리 | 13 | 26 years | 4.4 |
| 식료품점 및 슈퍼마켓 | 13 | — | 4.4 |
| 트랙터 및 농장 장비 | 12 | — | 4.4 |
| 모든 음식과 음료 | 12 | — | 4.1 |
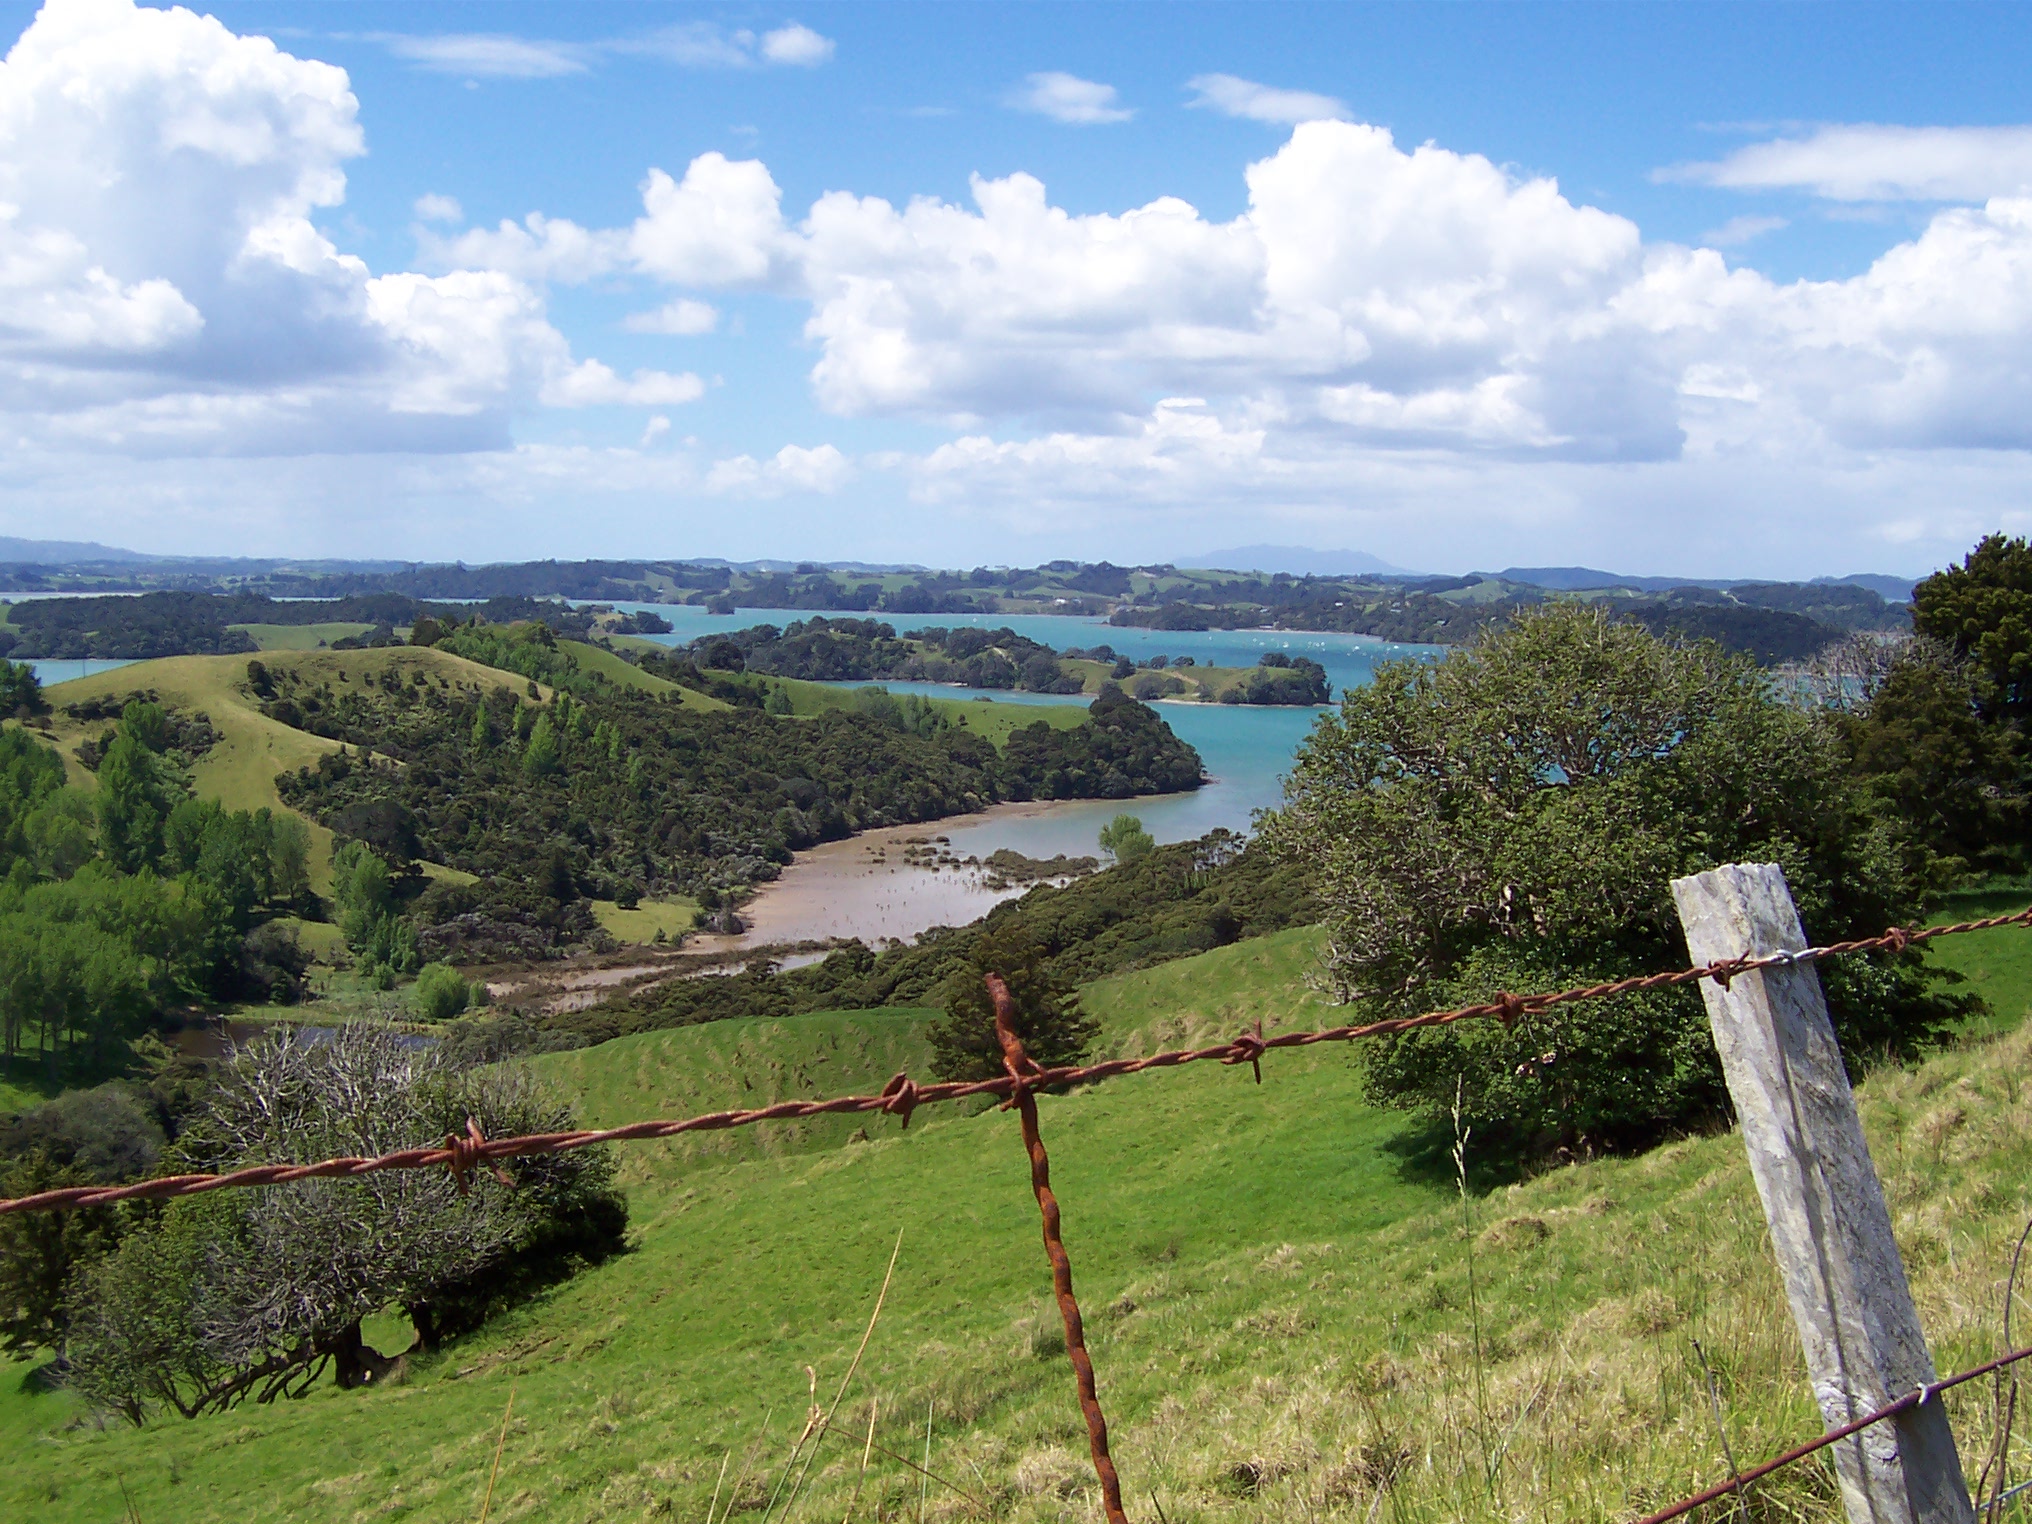
Wellsford 지도
대화식지도
Wellsford 인구
1975년부터 2020년까지
| Data | 1975 | 1990 | 2000 | 2015 | 2020 |
|---|---|---|---|---|---|
| 인구 | 545 | 660 | 769 | 954 | 996 |
| 인구 밀도 | 512.9 / km² | 621.2 / km² | 723.8 / km² | 897.9 / km² | 937.4 / km² |
출처: JRC (유럽 위원회 공동 연구 센터) 다음에 대한 작업 GHS 시가화 격자
2000년부터 2015년까지 Wellsford 인구 변화
2000년부터 2015년까지 24.1% 증가
| 위치 | 1975 이후 변화 | 1990 이후 변화 | 2000 이후 변화 |
|---|---|---|---|
| Wellsford | +75% | +44.5% | +24.1% |
| 뉴질랜드 | +47.1% | +33.3% | +17.4% |
출처: JRC (유럽 위원회 공동 연구 센터) 다음에 대한 작업 GHS 시가화 격자
Wellsford 중위 연령
중위 연령: 35.1세
| 위치 | 연령 중앙값 | 평균 연령 (여성) | 중간 나이 (남) |
|---|---|---|---|
| Wellsford | 35.1 yrs | 36.1 yrs | 34 yrs |
| 뉴질랜드 | 37.9 yrs | 38.9 yrs | 36.9 yrs |
출처: CIESIN (Center for International Earth Science Information Network)
Wellsford 인구 밀도
인구 밀도: 937 / km²
| 위치 | 인구 | 지역 | 밀도 |
|---|---|---|---|
| Wellsford | 996 | 1.063 km² | 937 / km² |
| 뉴질랜드 | 4.4 million | 270,103.3 km² | 16.3 / km² |
출처: JRC (유럽 위원회 공동 연구 센터) 다음에 대한 작업 GHS 시가화 격자
Wellsford 역사적 및 예상 인구
1200년부터 2100년까지의 예상 인구
출처:
- JRC (유럽 위원회 공동 연구 센터) 다음에 대한 작업 GHS built-up grid
- CIESIN (Center for International Earth Science Information Network)
- [링크] Klein Goldewijk, K., Beusen, A., Doelman, J., and Stehfest, E.: Anthropogenic land use estimates for the Holocene – HYDE 3.2, Earth Syst. Sci. Data, 9, 927–953, https://doi.org/10.5194/essd-9-927-2017, 2017.
Wellsford의 지역
Wellsford의 지역별 업체 비율
지역번호
Wellsford에 있는 사업체가 사용하는 지역 번호 비율
우편 번호
Wellsford의 우편번호별 업체 비율
가격 분포
Wellsford의 가격별 사업체 분포
인간 개발 지수 (HDI)
평균 수명, 교육 및 일인당 소득의 통계 복합 지수.
출처: [링크] Kummu, M., Taka, M. &Guillaume, J. 1990–2015년 국내총생산 및 인간개발지수에 대한 격자형 글로벌 데이터셋. Sci Data 5, 180004 (2018) doi:10.1038/sdata.2018.4
Wellsford CO2 배출량
일인당 연간 이산화탄소 배출량 (CO2)
| 위치 | 이산화탄소 배출 | 일인당 이산화탄소 배출량 | 이산화탄소 배출 강도 |
|---|---|---|---|
| Wellsford | 9,324 tn | 9.36 tn | 8,775.1 tons/km² |
| 뉴질랜드 | 37,929,206 tn | 8.61 tn | 140.4 tons/km² |
출처: [링크] Moran, D., Kanemoto K; Jiborn, M., Wood, R., Többen, J., and Seto, K.C. (2018) 13,000개 도시의 탄소 발자국. Environmental Research Letters DOI: 10.1088/1748-9326/aac72a
Wellsford CO2 배출량
| 2013년 CO2 배출량 (톤/년) | 9,324 tn |
| 2013년 1인당 CO2 배출량 (톤/년) | 9.36 tn |
| 2013년 CO2 배출 강도 (톤/km²/년) | 8,775.1 tons/km² |
자연 재해 위험
Relative risk out of 10
| 위험 | Risk Level |
|---|---|
| Flood | High (8) |
| Earthquake | Medium (4) |
* Risk, particularly concerning flood or landslide, may not be for the entire area.
출처:
- Dilley, M., R.S. Chen, U. Deichmann, A.L. Lerner-Lam, M. Arnold, J. Agwe, P. Buys, O. Kjekstad, B. Lyon, and G. Yetman. 2005. Natural Disaster Hotspots: A Global Risk Analysis. Washington, D.C.: World Bank. https://doi.org/10.1596/0-8213-5930-4.
- Center for Hazards and Risk Research - CHRR - Columbia University, Center for International Earth Science Information Network - CIESIN - Columbia University. 2005. Global Flood Hazard Frequency and Distribution. Palisades, NY: NASA Socioeconomic Data and Applications Center (SEDAC). https://doi.org/10.7927/H4668B3D.
- Center for Hazards and Risk Research - CHRR - Columbia University, Center for International Earth Science Information Network - CIESIN - Columbia University. 2005. Global Earthquake Hazard Distribution - Peak Ground Acceleration. Palisades, NY: NASA Socioeconomic Data and Applications Center (SEDAC). https://doi.org/10.7927/H4BZ63ZS.
최근 인근 지진
크기 3.0 이상
| 날짜▼ | 시간↕ | Magnitude↕ | Distance↕ | 깊이↕ | 위치↕ | 링크 |
|---|---|---|---|---|---|---|
| 3/13/07 | 2:02 AM | 4 | 82.5 km | 398,000 m | off the east coast of the North Island of New Zealand | usgs.gov |
| 2/21/07 | 10:23 AM | 3.8 | 54.7 km | 7,000 m | off the east coast of the North Island of New Zealand | usgs.gov |
| 2/21/07 | 8:00 AM | 4.5 | 54.3 km | 15,300 m | off the east coast of the North Island of New Zealand | usgs.gov |
| 12/17/03 | 3:11 PM | 4.5 | 37.3 km | 12,000 m | North Island of New Zealand | usgs.gov |
우리의 데이터
이 페이지의 데이터는 여러 공개적으로 이용 가능한 도구와 자원을 사용하여 추정됩니다. 보증 없이 제공되며 부정확한 내용이 포함될 수 있습니다. 사용은 본인 책임입니다.