산업
Uki-shi의 산업별 비즈니스 분포
| 산업 설명 | 시설 수 | 평균 Google 평가 |
|---|---|---|
| 쇼핑 | 6 | 3 |
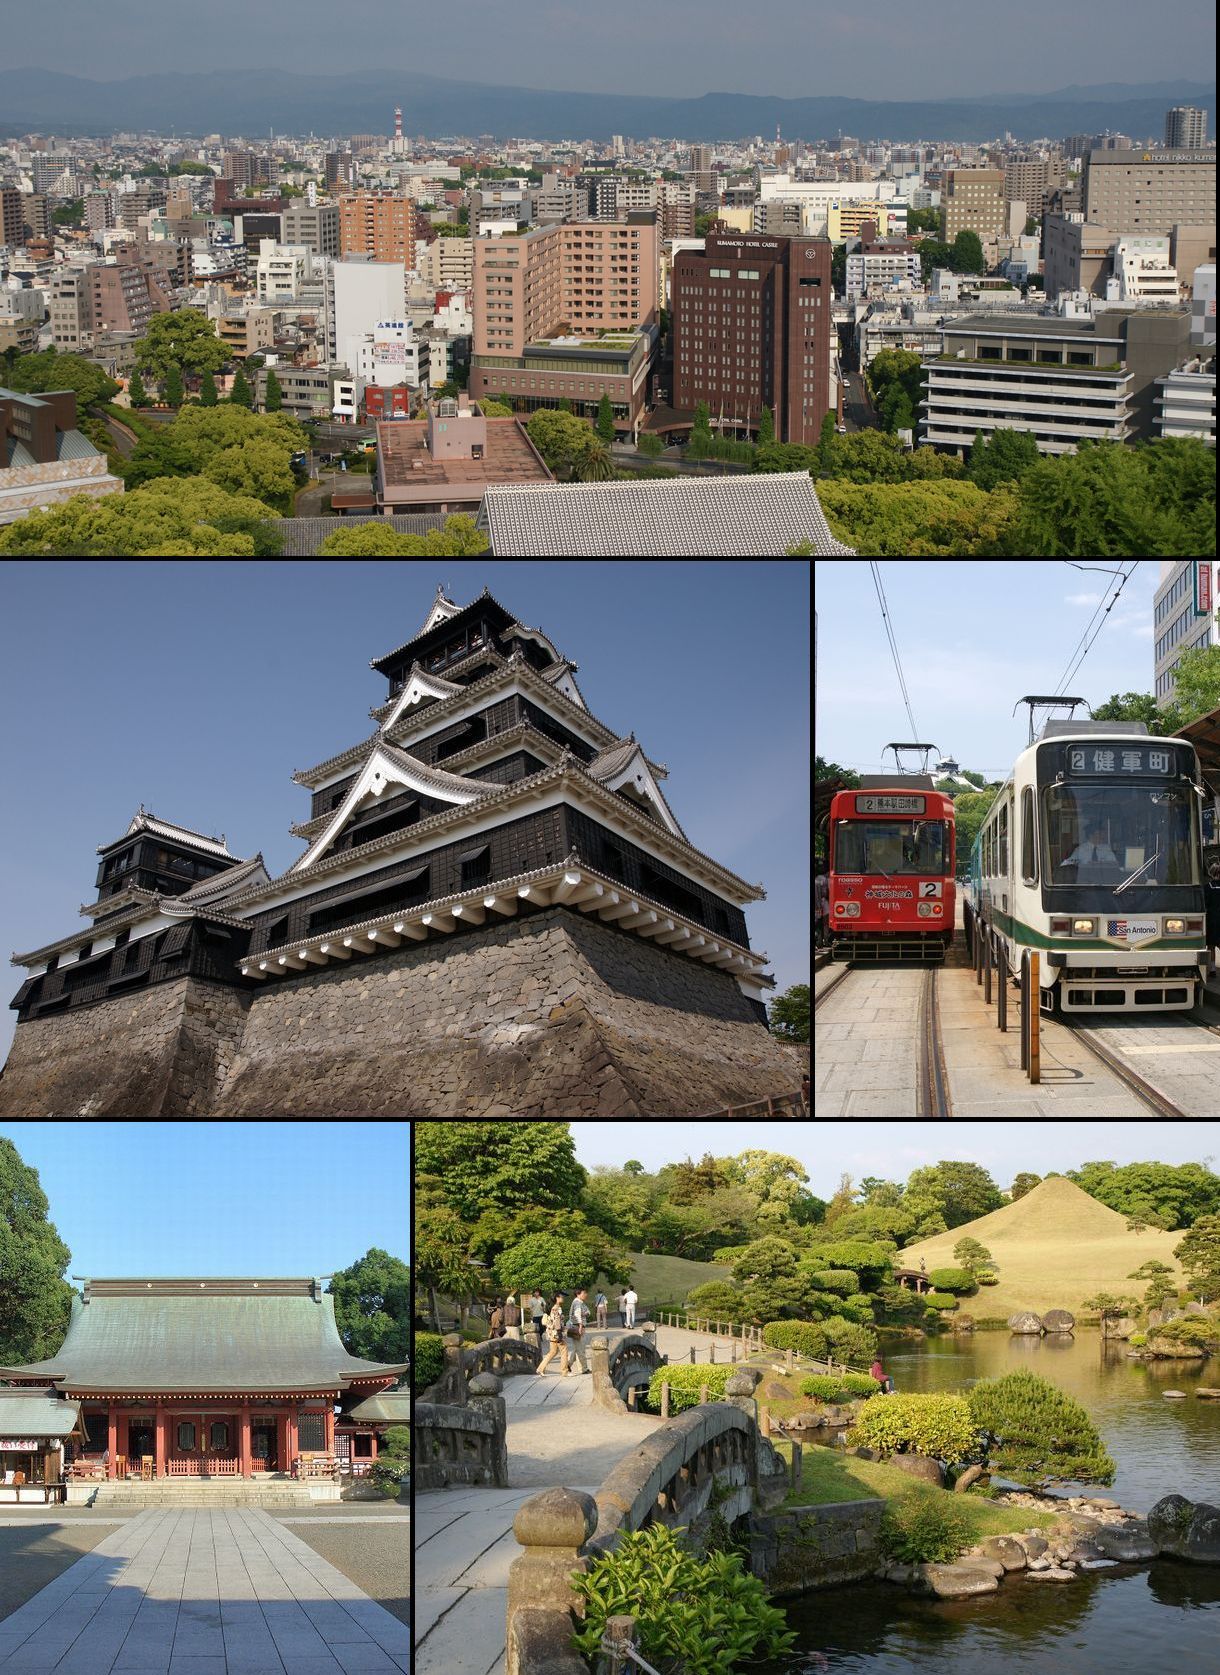
Uki-shi 지도
대화식지도
Uki-shi 인구
1975년부터 2020년까지
| Data | 1975 | 1990 | 2000 | 2015 | 2020 |
|---|---|---|---|---|---|
| 인구 | 58,046 | 61,212 | 61,162 | 58,683 | 57,500 |
| 인구 밀도 | 306.7 / km² | 323.4 / km² | 323.2 / km² | 310.1 / km² | 303.8 / km² |
출처: JRC (유럽 위원회 공동 연구 센터) 다음에 대한 작업 GHS 시가화 격자
2000년부터 2015년까지 Uki-shi 인구 변화
2000년부터 2015년까지 4.1% 감소
| 위치 | 1975 이후 변화 | 1990 이후 변화 | 2000 이후 변화 |
|---|---|---|---|
| Uki-shi | +1.1% | -4.1% | -4.1% |
| 구마모토 현 | +1.4% | -4.2% | -4% |
| 일본 | +13.6% | +3.4% | +0.6% |
출처: JRC (유럽 위원회 공동 연구 센터) 다음에 대한 작업 GHS 시가화 격자
Uki-shi 중위 연령
중위 연령: 49.9세
| 위치 | 연령 중앙값 | 평균 연령 (여성) | 중간 나이 (남) |
|---|---|---|---|
| Uki-shi | 49.9 yrs | 51.8 yrs | 47.7 yrs |
| 구마모토 현 | 47.8 yrs | 49.9 yrs | 45.5 yrs |
| 일본 | 45.1 yrs | 46.9 yrs | 43.5 yrs |
출처: CIESIN (Center for International Earth Science Information Network)
Uki-shi 인구 밀도
인구 밀도: 304 / km²
| 위치 | 인구 | 지역 | 밀도 |
|---|---|---|---|
| Uki-shi | 57,500 | 189.3 km² | 304 / km² |
| 구마모토 현 | 1.7 million | 7,397.2 km² | 235 / km² |
| 일본 | 122.9 million | 373,410.9 km² | 329 / km² |
출처: JRC (유럽 위원회 공동 연구 센터) 다음에 대한 작업 GHS 시가화 격자
Uki-shi 역사적 및 예상 인구
400년부터 2100년까지의 예상 인구
출처:
- JRC (유럽 위원회 공동 연구 센터) 다음에 대한 작업 GHS built-up grid
- CIESIN (Center for International Earth Science Information Network)
- [링크] Klein Goldewijk, K., Beusen, A., Doelman, J., and Stehfest, E.: Anthropogenic land use estimates for the Holocene – HYDE 3.2, Earth Syst. Sci. Data, 9, 927–953, https://doi.org/10.5194/essd-9-927-2017, 2017.
인간 개발 지수 (HDI)
평균 수명, 교육 및 일인당 소득의 통계 복합 지수.
출처: [링크] Kummu, M., Taka, M. &Guillaume, J. 1990–2015년 국내총생산 및 인간개발지수에 대한 격자형 글로벌 데이터셋. Sci Data 5, 180004 (2018) doi:10.1038/sdata.2018.4
Uki-shi CO2 배출량
일인당 연간 이산화탄소 배출량 (CO2)
| 위치 | 이산화탄소 배출 | 일인당 이산화탄소 배출량 | 이산화탄소 배출 강도 |
|---|---|---|---|
| Uki-shi | 128,737 tn | 2.24 tn | 680.3 tons/km² |
| 구마모토 현 | 3,205,723 tn | 1.85 tn | 433.4 tons/km² |
| 일본 | 541,995,101 tn | 4.41 tn | 1,451.5 tons/km² |
출처: [링크] Moran, D., Kanemoto K; Jiborn, M., Wood, R., Többen, J., and Seto, K.C. (2018) 13,000개 도시의 탄소 발자국. Environmental Research Letters DOI: 10.1088/1748-9326/aac72a
Uki-shi CO2 배출량
| 2013년 CO2 배출량 (톤/년) | 128,737 tn |
| 2013년 1인당 CO2 배출량 (톤/년) | 2.24 tn |
| 2013년 CO2 배출 강도 (톤/km²/년) | 680.3 tons/km² |
자연 재해 위험
Relative risk out of 10
| 위험 | Risk Level |
|---|---|
| Flood | Medium (4) |
| Earthquake | High (8.6) |
| Cyclone | High (10) |
| Landslide | High (9) |
| Volcano | Medium (4) |
* Risk, particularly concerning flood or landslide, may not be for the entire area.
출처:
- Dilley, M., R.S. Chen, U. Deichmann, A.L. Lerner-Lam, M. Arnold, J. Agwe, P. Buys, O. Kjekstad, B. Lyon, and G. Yetman. 2005. Natural Disaster Hotspots: A Global Risk Analysis. Washington, D.C.: World Bank. https://doi.org/10.1596/0-8213-5930-4.
- Center for Hazards and Risk Research - CHRR - Columbia University, Center for International Earth Science Information Network - CIESIN - Columbia University, and Norwegian Geotechnical Institute - NGI. 2005. Global Landslide Hazard Distribution. Palisades, NY: NASA Socioeconomic Data and Applications Center (SEDAC). https://doi.org/10.7927/H4P848VZ.
- Center for Hazards and Risk Research - CHRR - Columbia University, Center for International Earth Science Information Network - CIESIN - Columbia University, International Bank for Reconstruction and Development - The World Bank, and United Nations Environment Programme Global Resource Information Database Geneva - UNEP/GRID-Geneva. 2005. Global Cyclone Hazard Frequency and Distribution. Palisades, NY: NASA Socioeconomic Data and Applications Center (SEDAC). https://doi.org/10.7927/H4CZ353K.
- Center for Hazards and Risk Research - CHRR - Columbia University, Center for International Earth Science Information Network - CIESIN - Columbia University. 2005. Global Flood Hazard Frequency and Distribution. Palisades, NY: NASA Socioeconomic Data and Applications Center (SEDAC). https://doi.org/10.7927/H4668B3D.
- Center for Hazards and Risk Research - CHRR - Columbia University, Center for International Earth Science Information Network - CIESIN - Columbia University. 2005. Global Volcano Hazard Frequency and Distribution. Palisades, NY: NASA Socioeconomic Data and Applications Center (SEDAC). https://doi.org/10.7927/H4BR8Q45.
- Center for Hazards and Risk Research - CHRR - Columbia University, Center for International Earth Science Information Network - CIESIN - Columbia University. 2005. Global Earthquake Hazard Distribution - Peak Ground Acceleration. Palisades, NY: NASA Socioeconomic Data and Applications Center (SEDAC). https://doi.org/10.7927/H4BZ63ZS.
최근 인근 지진
크기 3.0 이상
| 날짜▼ | 시간↕ | Magnitude↕ | Distance↕ | 깊이↕ | 위치↕ | 링크 |
|---|---|---|---|---|---|---|
| 10/15/18 | 12:12 AM | 4.5 | 4.9 km | 10,000 m | 6km WSW of Matsubase, Japan | usgs.gov |
| 8/22/18 | 9:23 AM | 4.5 | 13.6 km | 10,000 m | 7km NNW of Uto, Japan | usgs.gov |
| 7/24/18 | 10:31 PM | 4.4 | 22.1 km | 8,020 m | 13km ESE of Kumamoto-shi, Japan | usgs.gov |
| 5/6/18 | 12:13 PM | 4.4 | 22.6 km | 22,100 m | 9km SSW of Ueki, Japan | usgs.gov |
| 5/11/17 | 11:21 AM | 4.8 | 12.1 km | 10,000 m | 7km NW of Uto, Japan | usgs.gov |
| 5/4/17 | 5:22 AM | 4.6 | 6.8 km | 10,000 m | 1km WNW of Uto, Japan | usgs.gov |
| 11/23/16 | 11:10 AM | 3.5 | 15.5 km | 10,510 m | 10km NW of Uto, Japan | usgs.gov |
| 11/11/16 | 1:12 AM | 4.2 | 14.6 km | 10,000 m | 7km S of Kumamoto-shi, Japan | usgs.gov |
| 9/6/16 | 4:56 PM | 4.3 | 4.9 km | 14,650 m | 3km WSW of Uto, Japan | usgs.gov |
| 8/31/16 | 9:33 PM | 4.6 | 14.3 km | 9,740 m | 10km NW of Uto, Japan | usgs.gov |


우리의 데이터
이 페이지의 데이터는 여러 공개적으로 이용 가능한 도구와 자원을 사용하여 추정됩니다. 보증 없이 제공되며 부정확한 내용이 포함될 수 있습니다. 사용은 본인 책임입니다.